> ## Documentation Index
> Fetch the complete documentation index at: https://docs.bult.ai/llms.txt
> Use this file to discover all available pages before exploring further.
# Monitoring
#### Logs
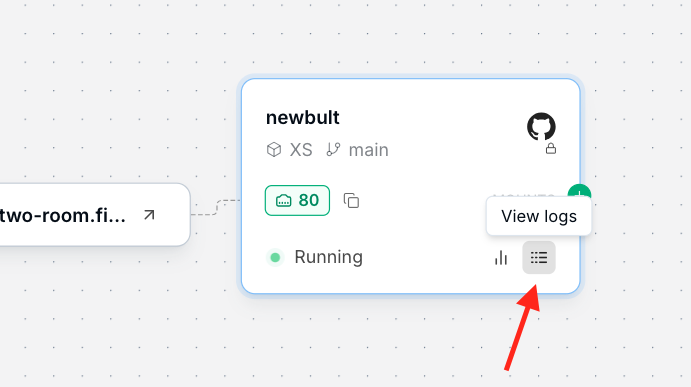
Access 7-day logs (Basic plan) or 30-day logs (Pro plan):
in Canvas UI’s “View logs” button:
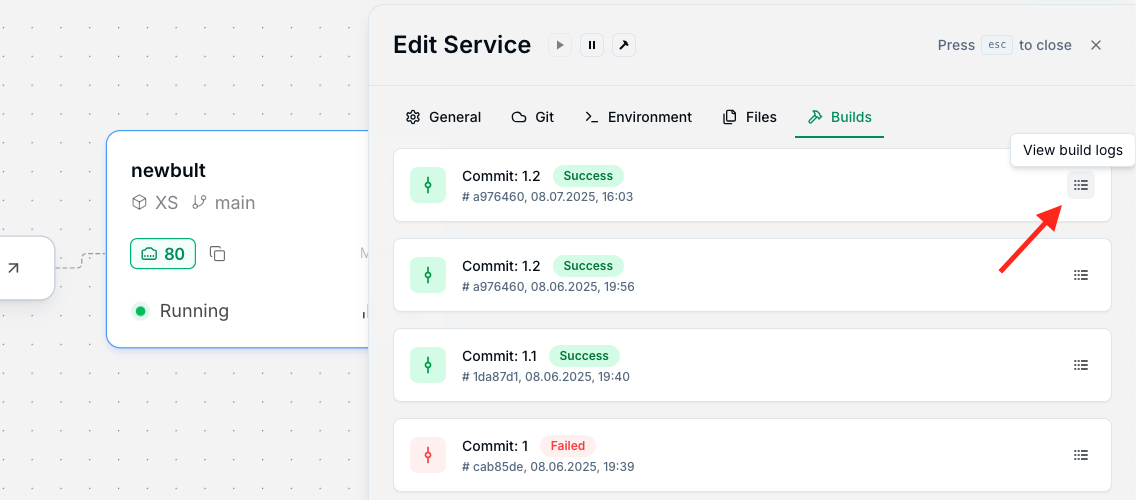
 or “View build logs” button in the "Edit Service" under "Builds":
 #### Usage
Track CPU, RAM, and Volume usage in [app.bult.ai/usage](https://app.bult.ai/usage).
#### Service Metrics
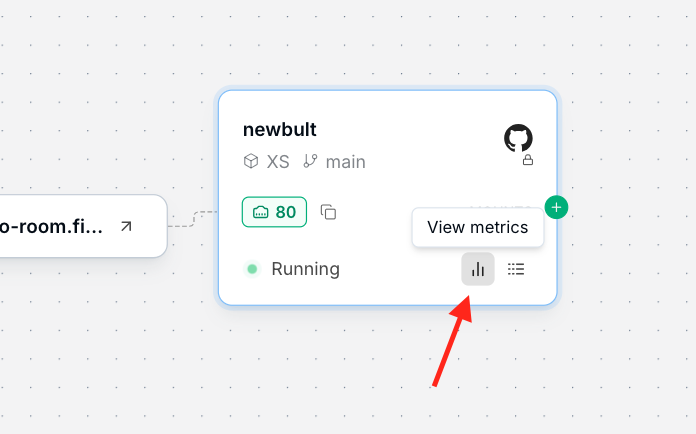
View real-time metrics (e.g., response time, errors) in “View metrics” button.
#### Usage
Track CPU, RAM, and Volume usage in [app.bult.ai/usage](https://app.bult.ai/usage).
#### Service Metrics
View real-time metrics (e.g., response time, errors) in “View metrics” button.
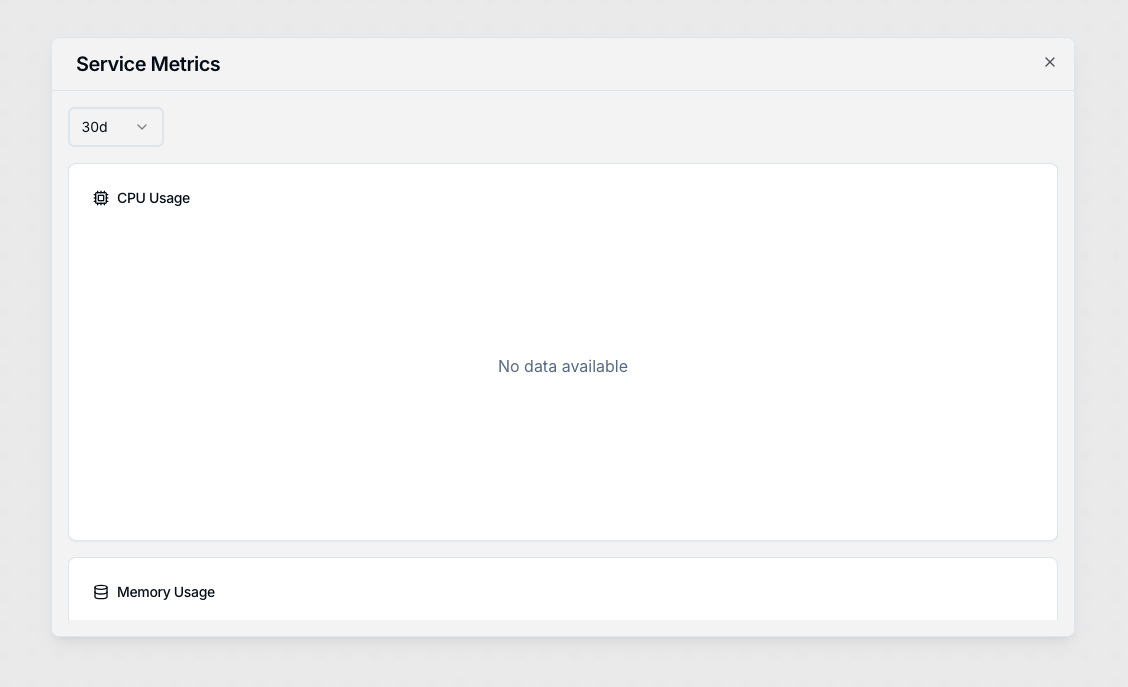
 Service Metrics window shows CPU Usage, Memory Usage, and Network I/O for a specific period of time: