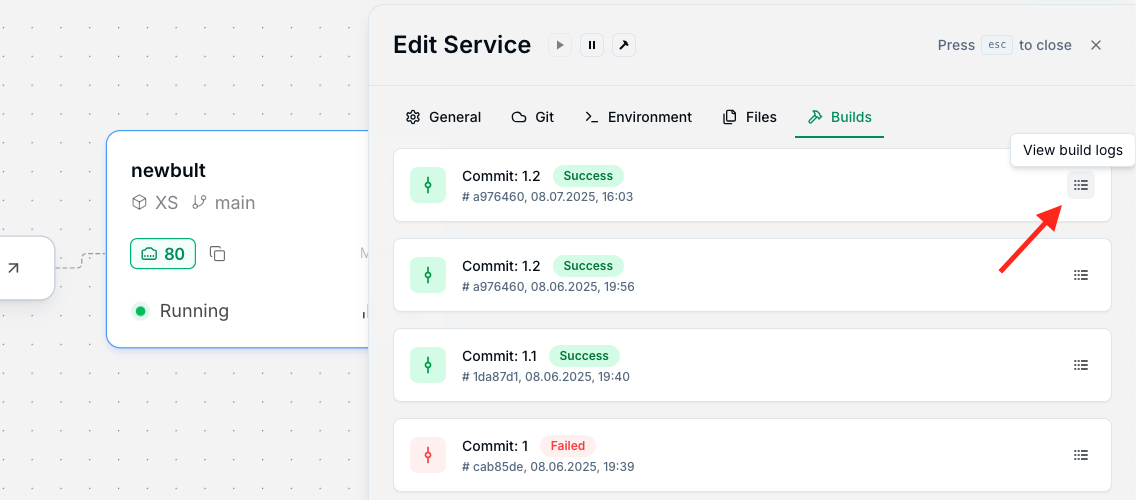
Bult docs home page
Search...
⌘K
Support
Start for free
Start for free
Search...
Navigation
Guides
Monitoring
Documentation
bult.ai
Get Started
Welcome
Quick Start
Guides
Foundations
Languages & Frameworks
Networking
Builds
Deployments
Database
Monitoring
Templates
Custom Domains
Regions
Compute Sizes
Usage
Tutorials
Technical Tutorials
Reference
Pricing
Support
Comparison
Migration
Community
On this page
Logs
Usage
Service Metrics
Guides
Monitoring
Logs
Access 7-day logs (Basic plan) or 30-day logs (Pro plan):
in Canvas UI’s “View logs” button:
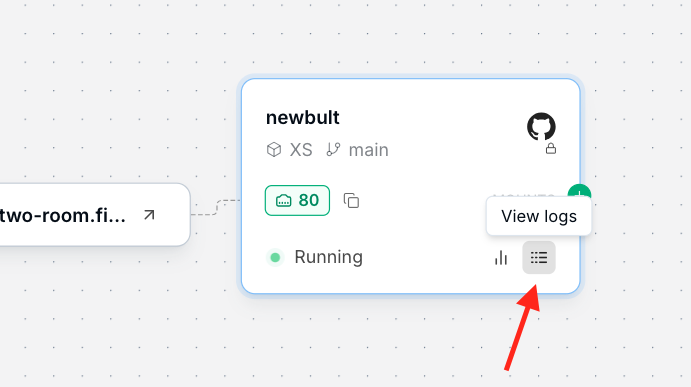
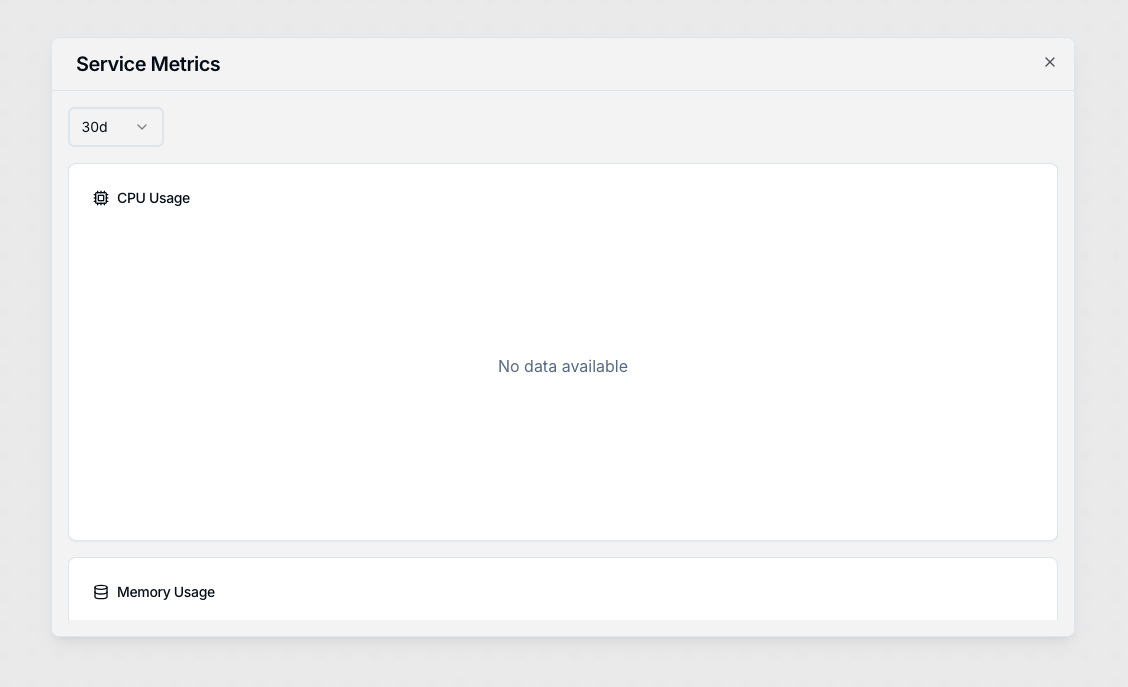
or “View build logs” button in the “Edit Service” under “Builds”:
Usage
Track CPU, RAM, and Volume usage in
app.bult.ai/usage
.
Service Metrics
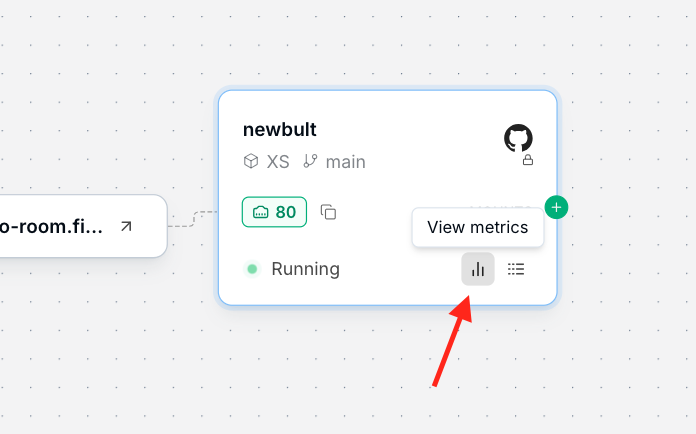
View real-time metrics (e.g., response time, errors) in “View metrics” button.
Service Metrics window shows CPU Usage, Memory Usage, and Network I/O for a specific period of time:
Database
Templates
Assistant
Responses are generated using AI and may contain mistakes.